Neighborhood Emission Mapping Operation
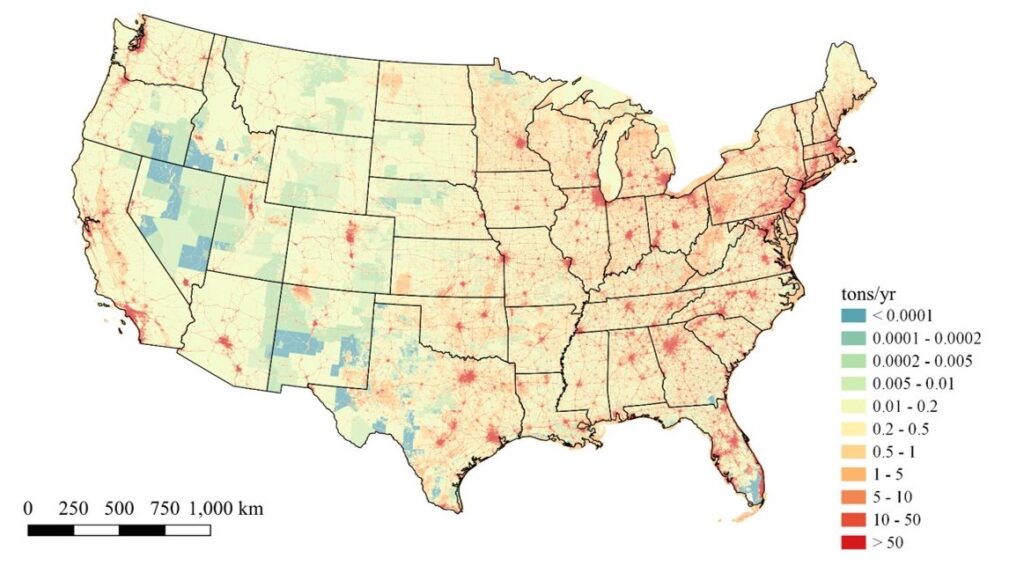
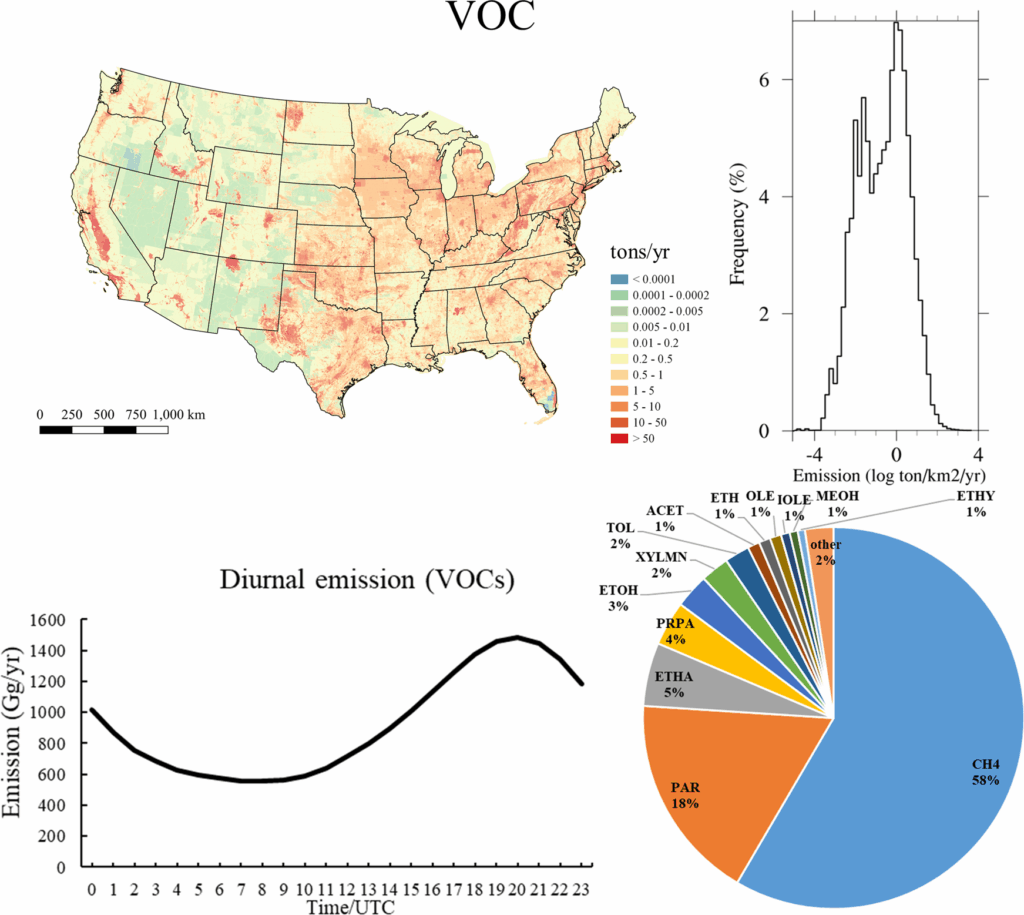
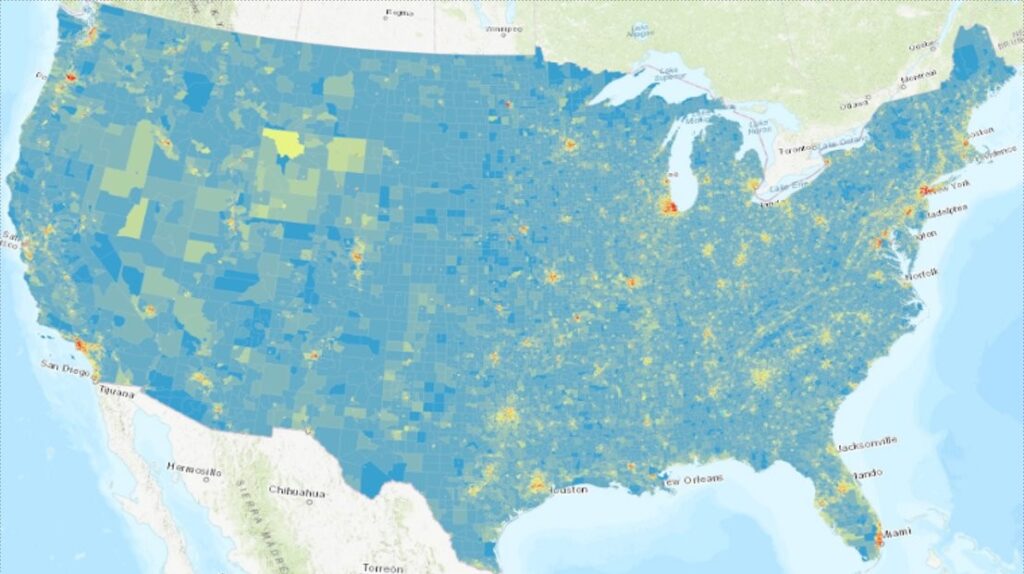
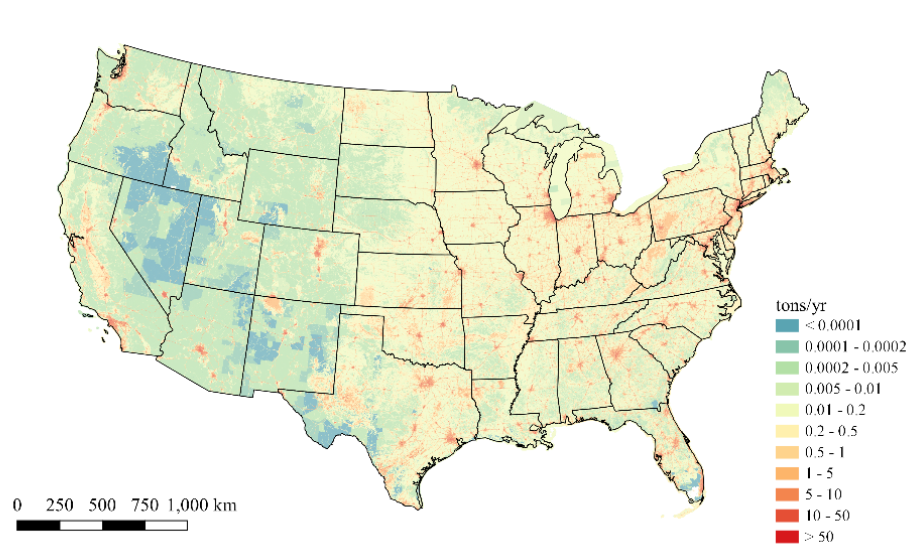
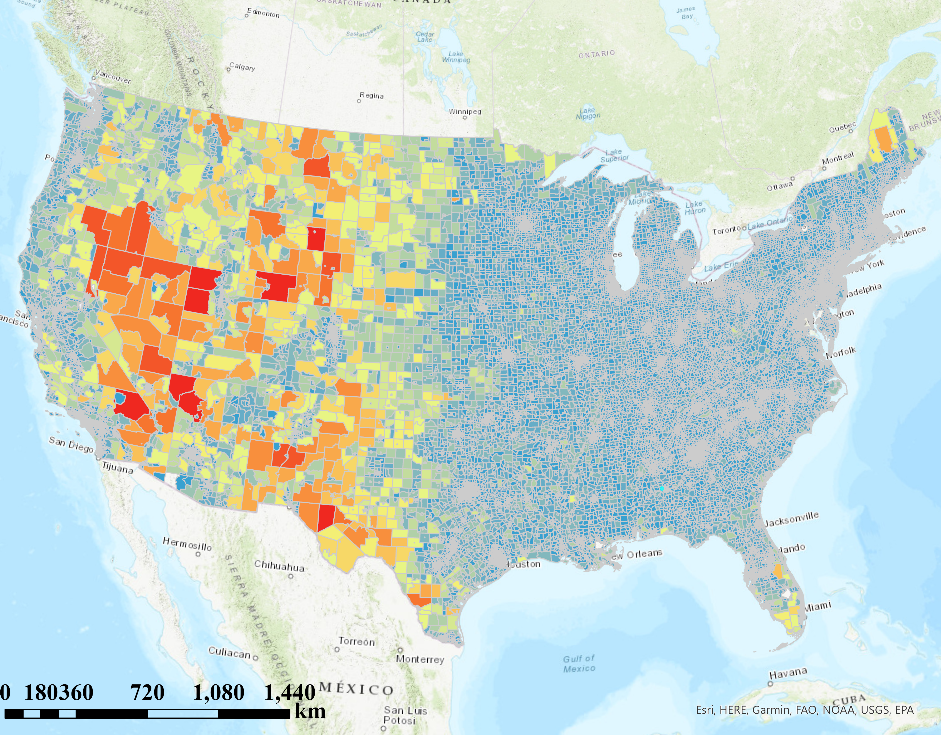
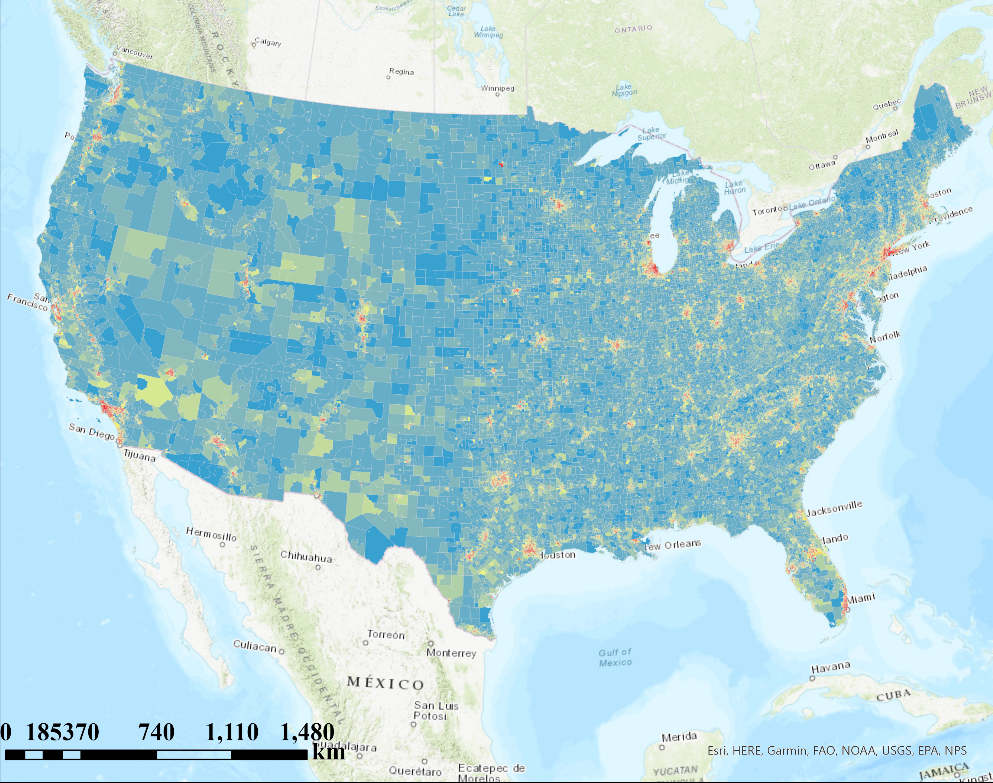
The Neighborhood Emission Mapping Operation (NEMO) is a high-resolution (1km) dataset of air pollutant emissions from human activities over the Contiguous United States (CONUS). NEMO includes air pollutants such as volatile organic compounds (VOCs), nitrogen oxides (NOx), carbon monoxide (CO), sulfur dioxide (SO2), ammonia (NH3), and particulate matters (PM, both PM2.5 and PM10). It is produced by the air quality research team at George Mason University based on the National Emission Inventories from United States Environmental Protection Agency (US EPA).
Methods
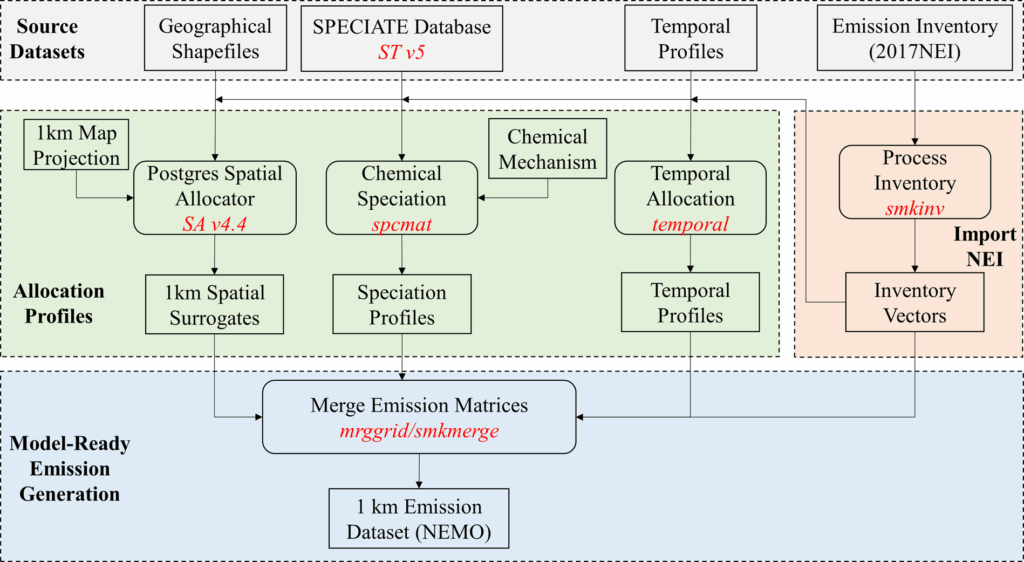
Model and Tool
Spatial Allocator v4.4 SMOKEv4.7
Emission Inventory
US EPA National Emissions Inventory 2017
Anthropogenic source sectors
6 area sectors, 2 mobile sectors and 1 point source sector
Chemical Mechanisms
CB6r3 with AE7 aerosol mechanism
Downloads
NEMO are available in two formats: NetCDF and Shapefile. Both formats have the same emission sectors with 1 km resolution in the Lambert Conformal Conic (LCC) projection. The NetCDF format contains hourly, monthly, and annual data while the Shapefiles only include annual emissions. Additionally, the NetCDF provides the model species for CB6 mechanism in the hourly and monthly data files. The shapefiles include total emissions of VOCs, NOx, PM2.5, SO2, CO, and NH3.
- The datafiles of monthly and annual nonpoint emissions that are available on figshare reservoir: https://doi.org/10.6084/m9.figshare.c.6141735.
The annual emission for airports sector in .shp format is available here. - The annual nonpoint emissions (2017, 2019) in shapefile format are now available.
- The hourly sectoral emissions at census level are available here.
- If you want to download the hourly emission data, please contact us.
Dataset
Air Pollutants
NOx, VOCs, CO, SO2, NH3, PM2.5 and PM1PM2.5 and PM10 Composition
Data Format
NetCDF, Shapefile (Annual only), ASCII (Census tract)Inventory Base Year
2017, 2019Emission Sources (Sectoral & Total)
Anthropogenic fugitive dust (afdust), Agriculture (ag)/Fertilizer&Livestock, Non-point (nonpt), Oil and Gas (np_oilgas), Solvents (np_solvents), Onroad, Nonroad, Rail, Residential wood combustion (rwc) & AirportsTemporal resolution
Annual, Monthly, and HourlySpatial resolution
1 km x 1 kmParticulate Matter 2.5 μm

Nitrogen Oxide
Publications
Ma, S., Tong, D.Q. Neighborhood Emission Mapping Operation (NEMO): A 1-km anthropogenic emission dataset in the United States. Sci Data 9, 680 (2022). https://doi.org/10.1038/s41597-022-01790-9
Acknowledgement
This work is partially supported by NOAA Climate Program Office and NASA Health and Air Quality Program. We thank the US EPA for providing the base emissions inventories and ancillary files used in this study. The authors are grateful to Bok Haeng Baek, Dongmei Yang, and Charles Chang for insightful discussion and assistance with preparing the data/tools and the website.